Module 4: How to Draw Fibonacci Levels: Step-by-Step Guide for Crypto Traders
Properly drawing Fibonacci levels is a fundamental skill that separates successful traders from those who constantly receive false signals. Even the most powerful technical analysis tool is useless if applied incorrectly. In this lesson, you'll master the precise methodology for constructing levels that works on any cryptocurrency asset and timeframe.
Key Principle: Fibonacci levels aren't drawn arbitrarily — they're constructed from one significant point to another, reflecting the actual market structure. An error in selecting anchor points invalidates all subsequent analysis.
Swing Highs and Swing Lows: The Foundation of Construction
Before opening the Fibonacci tool, you need to learn how to flawlessly identify key points on the chart. These points are called swing highs and swing lows, and the accuracy of all your constructions depends on them.
What Is a Swing High
A swing high is a local price maximum that forms when:
- At least two candles to the left have lower highs
- At least two candles to the right also have lower highs
- The center candle is the highest point in that price movement
Visually, a swing high looks like a "hill" or "peak" on the chart — price was rising, reached a maximum, and reversed downward.

What Is a Swing Low
A swing low is a local price minimum defined by mirror criteria:
- At least two candles to the left have higher lows
- At least two candles to the right also have higher lows
- The center candle is the lowest point in that price movement
A swing low looks like a "valley" or "bottom" — price was falling, reached a minimum, and reversed upward.

Practical Tip
Don't confuse swing points with just any local extremes. A true swing must be significant — meaning it represents a point where a real change in direction occurred, not just a small pause within a trend. The more candles that confirm the extreme on each side, the more reliable the point for construction.
The Direction Rule: From Start to End of Movement
There's a universal rule that determines the direction for constructing Fibonacci levels:
| Trend Type | Starting Point (0%) | Ending Point (100%) | Construction Direction |
|---|---|---|---|
| Uptrend | Swing Low (minimum) | Swing High (maximum) | Bottom to Top |
| Downtrend | Swing High (maximum) | Swing Low (minimum) | Top to Bottom |
This rule is intuitive: you always construct levels in the direction of the main movement — from the point where the movement started to the point where it ended (or paused).
Drawing on an Uptrend: Step-by-Step Instructions
Let's examine the detailed algorithm for constructing Fibonacci retracement levels in a rising market.
Step 1: Identify the Uptrend
Before drawing levels, make sure you're actually looking at an uptrend. Signs of an uptrend:
- A sequence of higher highs
- A sequence of higher lows
- Price is above key moving averages (e.g., MA 50 or MA 200)
- Overall direction of movement is upward
Step 2: Identify the Swing Low (Starting Point)
Find the significant minimum from which the current upward movement began. This should be a point where:
- A clear reversal from downward to upward movement occurred
- A clear reversal structure formed (e.g., double bottom, hammer, engulfing pattern)
- Trading volume confirms the significance of the level
Step 3: Identify the Swing High (Ending Point)
Find the maximum where the upward movement stopped or began correcting:
- Price reached a peak and started declining
- A clear local maximum formed
- Signs of weakening upward momentum appeared
Step 4: Draw the Fibonacci Grid
Now perform the actual construction:
- Select the "Fibonacci Retracement" tool on your trading platform
- Click on the swing low (this will be the 0% or 100% level — depends on platform settings)
- While holding the mouse button, drag the line to the swing high
- Release the button — the level grid is constructed

Step 5: Interpret the Levels
After construction, horizontal levels will appear on the chart. In an uptrend, these levels show potential support zones where the correction may end and the trend continue:
- 23.6% — shallow retracement, characteristic of strong impulse moves
- 38.2% — moderate retracement, often seen in healthy trends
- 50% — psychologically important "halfway" level
- 61.8% — the "golden" level, deep but still normal retracement
- 78.6% — very deep retracement, the boundary between pullback and reversal
✓ Correct Construction
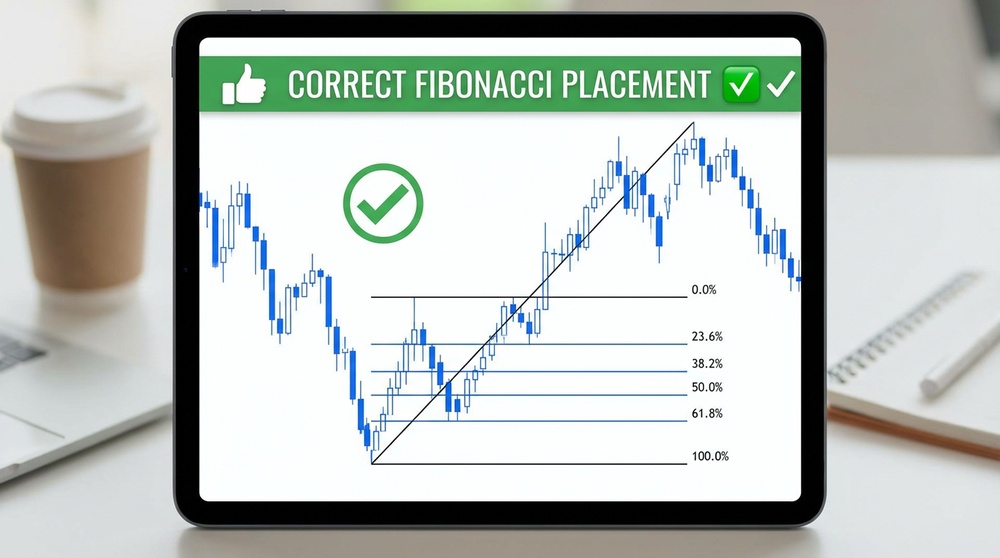
Grid drawn from a clear swing low to a confirmed swing high. Levels logically correspond to previous support/resistance zones.
✗ Incorrect Construction
Starting point selected on an insignificant minimum within the trend. Levels don't match the actual market structure.
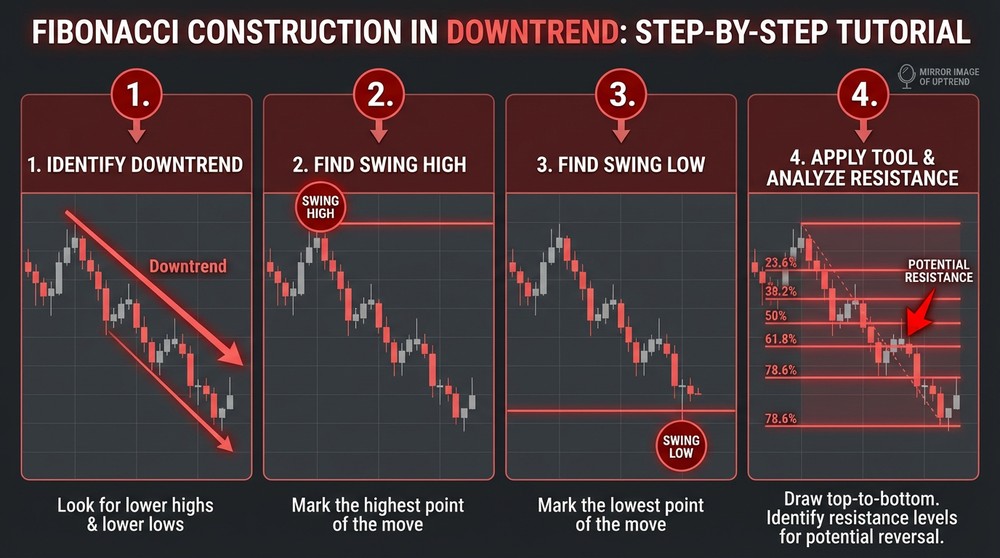
Drawing on a Downtrend: Step-by-Step Instructions
The algorithm for a downtrend mirrors the uptrend but requires the same thoroughness in selecting points.
Step 1: Identify the Downtrend
Signs of a downtrend:
- A sequence of lower highs
- A sequence of lower lows
- Price is below key moving averages
- Overall direction of movement is downward
Step 2: Identify the Swing High (Starting Point)
Find the significant maximum from which the current downward movement began:
- The reversal point from growth to decline
- Often accompanied by bearish patterns (double top, shooting star)
- Increased volume on the reversal
Step 3: Identify the Swing Low (Ending Point)
Find the minimum where the downward movement stopped:
- Price reached a bottom and started bouncing
- A local minimum formed
- Signs of exhaustion in downward momentum appeared
Step 4: Draw the Grid
- Select the "Fibonacci Retracement" tool
- Click on the swing high (start of the downward movement)
- Drag the line down to the swing low
- Release — the grid is constructed

Step 5: Interpret the Levels
In a downtrend, Fibonacci levels show potential resistance zones where the corrective rally may end and the decline continue:
- 23.6% — weak bounce, bears maintain full control
- 38.2% — standard retracement in a strong downtrend
- 50% — middle of the movement, often tested
- 61.8% — deep retracement, the bears' last stronghold
- 78.6% — critical level, a break above questions the downtrend
Important Note on Terminology
Different trading platforms may display percentages differently (0% at the bottom or top). The essence remains the same: levels are always constructed from the start of the movement to its end. If in your platform 0% ends up at the swing high during an uptrend — it's just an inverted display; mathematically, the levels remain the same.
Choosing a Timeframe: A Strategic Approach
Fibonacci levels can be drawn on any timeframe, but their significance and practical application differ substantially.
Higher Timeframes (1D, 1W, 1M)
| Characteristic | Description |
|---|---|
| Level Significance | Maximum — these levels are seen by all market participants |
| Accuracy of Execution | High — more confirming data available |
| Application | Identifying global entry zones, strategic planning |
| Disadvantage | Wide zones, signals appear rarely |
Medium Timeframes (4H, 1H)
| Characteristic | Description |
|---|---|
| Level Significance | High — used by most swing traders |
| Accuracy of Execution | Good — optimal signal-to-noise balance |
| Application | Swing trading, finding entry points in the direction of the trend |
| Disadvantage | Requires patience, not suitable for scalping |
Lower Timeframes (15M, 5M, 1M)
| Characteristic | Description |
|---|---|
| Level Significance | Low — lots of market noise |
| Accuracy of Execution | Variable — many false signals |
| Application | Refining entry after a signal from a higher TF, scalping |
| Disadvantage | High noise level, requires experience |

The Principle of Multi-Timeframe Analysis
Professional traders use a multi-level approach:
- Higher TF — determining the global trend and key levels
- Medium TF — constructing working Fibonacci levels
- Lower TF — finding the entry point and confirmation pattern
Golden Rule: A Fibonacci level is significantly strengthened if it coincides across multiple timeframes. Such "confluence" creates powerful support or resistance zones.
Criteria for Selecting Significant Swings
Not every local extreme is suitable for constructing levels. Here are criteria that will help you choose the right points:
Criterion 1: Visual Obviousness
A good swing should be noticeable "to the naked eye." If you have to squint and doubt — it's probably not the right extreme.
Criterion 2: Significance of the Movement
Swing points should bound a substantial price movement:
- For Bitcoin's daily chart — a movement of at least several percent
- For altcoins — a movement that noticeably changed the market structure
- Avoid micro-movements within consolidation
Criterion 3: Structural Confirmation
Ideal points for construction often coincide with:
- Previous support/resistance levels
- Round psychological levels
- High-volume zones
- Liquidity levels (areas where stop-losses cluster)
Criterion 4: Completeness of Movement
Make sure the swing is confirmed by subsequent movement:
- A swing high is confirmed when price moved down and didn't return to the maximum
- A swing low is confirmed when price moved up and didn't return to the minimum
- At least 2-3 confirming candles on each side

Automatic vs. Manual Construction
Modern trading platforms offer both manual Fibonacci tools and automatic indicators. Let's consider the pros and cons of each approach.
Manual Construction
Advantages:
- Full control over point selection
- Consideration of context and market structure
- Development of chart reading skills
- Flexibility in non-standard situations
Disadvantages:
- Requires time and attention
- Subjectivity in point selection
- Possible errors when fatigued
Automatic Construction
Advantages:
- Time savings
- Algorithm objectivity
- Instant updates with new data
- Elimination of emotional factor
Disadvantages:
- Doesn't consider context
- May select insignificant points
- Limited customization
Recommendation: Beginning traders should master manual construction — it develops understanding of market structure. Automatic tools can be used as supplementary, but the final decision should always be made by a human.
Configuring Level Display
Most trading platforms allow you to customize the display of Fibonacci levels. Here are optimal settings for your work:
Main Levels (Required)
- 0% — start of movement
- 23.6% — first retracement level
- 38.2% — standard retracement
- 50% — psychological midpoint
- 61.8% — golden ratio
- 78.6% — deep retracement
- 100% — end of movement
Additional Levels (Optional)
- 127.2% — first extension target
- 161.8% — golden extension
- 261.8% — distant target
Visual Settings
- Line color: contrasting to the chart background but not irritating
- Thickness: key levels (38.2%, 50%, 61.8%) — thicker than others
- Zone fill: semi-transparent fill between levels helps visualize zones
- Labels: display of percentages and/or price values

Checklist for Correct Construction
Use this checklist every time you construct Fibonacci levels:
Fibonacci Construction Checklist
- Trend identified — I clearly understand whether it's an uptrend or downtrend
- Swing points are significant — selected extremes are obvious and confirmed
- Direction is correct — construction goes from start of movement to end
- Timeframe is appropriate — selected TF suits my trading strategy
- Levels are logical — constructed levels correspond to visible market structure
- No conflict with other constructions — if there are multiple options, the most obvious one is chosen
- Context is considered — I understand the overall market situation and news background
Typical Construction Scenarios
Let's examine several practical scenarios you'll encounter in real trading.
Scenario 1: Impulse and Correction
The most classic case — price made an impulse move and started correcting.
- Action: Draw levels from the start of the impulse to its completion
- Goal: Determine where the correction may end
- Expectation: Bounce from one of the Fibonacci levels
Scenario 2: Breakout and Retest
Price broke an important level and is returning to test it.
- Action: Draw levels from the swing to the breakout point
- Goal: Determine the depth of the possible retest
- Expectation: Retest to 38.2-50% followed by continuation of movement
Scenario 3: Consolidation After a Trend
After a strong trend, price entered a sideways range.
- Action: Draw levels from the start of the trend to the start of consolidation
- Goal: Determine potential targets upon breakout from consolidation
- Expectation: Breakout in the direction of the trend with targets at extension levels

Frequently Asked Questions About Construction
What if the trend consists of multiple waves?
In a multi-wave trend, you can draw multiple Fibonacci levels:
- Global levels — from the start of the entire trend to the current extreme
- Local levels — from the start of the last wave to its completion
Zones where global and local levels coincide are the strongest.
Draw from wicks or candle bodies?
This is one of the most debated questions. The practical answer:
- From wicks — shows absolute extremes where real trades occurred
- From bodies — shows closing levels, which may be more psychologically significant
- Recommendation: Start by drawing from wicks, but consider both options as a zone, not an exact line
What to do if price broke through all levels?
If price broke the 100% level (completely negated the previous movement):
- The trend has likely reversed
- You need to redraw levels in the opposite direction
- Old levels lose relevance
Practical Assignment
To reinforce the material, complete the following exercise:
- Open the Bitcoin chart on the daily timeframe
- Find the last significant upward movement (at least 10-15%)
- Identify the swing low and swing high of this movement
- Draw Fibonacci retracement levels
- Check how price reacted to the constructed levels
- Repeat the exercise for a downward movement
- Compare the significance of levels on daily and 4-hour charts
Practice Tip: Keep a trading journal where you record all your Fibonacci constructions. Note which levels worked and which were broken. After a few weeks, you'll see patterns and understand which constructions work best for your assets.
Key Takeaways from This Lesson
- Construction accuracy determines effectiveness — incorrectly chosen points give useless levels
- Swing points must be significant — these are obvious extremes confirmed by subsequent movement
- Direction is always from start to end of movement — bottom to top during growth, top to bottom during decline
- Timeframe affects significance — levels from higher TFs are stronger but give signals less frequently
- Level confluence strengthens the zone — Fibonacci coinciding with other factors creates powerful levels
- Levels are zones, not exact lines — expect reaction in the area of the level, not exactly on it
In the next lesson, we'll thoroughly examine Fibonacci retracement — the most popular tool from the entire family, which allows you to find optimal entry points into an existing trend.