Module 9: Practical Examples of Fibonacci Levels in Trading
Theory without practice is like a key without a lock. In previous lessons, we thoroughly studied all Fibonacci tools: retracement, extension, time zones, arcs, and fans. Now it's time to bring this knowledge together and apply it to real charts. In this lesson, you'll see step-by-step breakdowns of trading situations that will teach you to make informed decisions in the market.
Important to understand: The examples presented demonstrate typical market situations that regularly repeat across any assets and timeframes. Specific prices and dates don't matter — what matters is the logic of analysis and decision-making.
Example 1: Classic Retracement in an Uptrend
Chart Situation
Imagine the following picture: an asset made a powerful impulse rally, increasing in price by 80% over several weeks. After such a move, the price starts declining. The question: where to look for a long entry point?

Step-by-Step Analysis
Step 1: Identifying the impulse. Find the starting point of the rally (swing low) and the ending point (swing high). These are the two key points for building the Fibonacci grid.
Step 2: Building retracement levels. Stretch the "Fibonacci Retracement" tool from the low to the high. The chart displays levels at 23.6%, 38.2%, 50%, 61.8%, and 78.6%.
Step 3: Observing price action. Price declines and reaches the 38.2% level. Here forms the first potential reversal zone, but selling volume remains high — a weak signal.
Step 4: Waiting for confirmation. Price breaks through 38.2% and moves toward the 50% level. At this level, a bullish engulfing candle appears with increased volume. This is a strong signal!
Step 5: Entering the position. Open a long position after the confirmation candle closes. Set the stop-loss just below the 61.8% level — this is our scenario "invalidation line."
Key Insight
The 50% level technically isn't a Fibonacci number, but traders include it in their analysis because the market often "remembers" half of the distance traveled. It's a psychologically important mark.
Trade Result
After bouncing from the 50% level, price resumes its upward movement. The first target is the previous high (0% retracement level). The second target is determined using Fibonacci extension — more on this in the next example.
| Trade Parameter | Value |
|---|---|
| Entry Point | 50% retracement level |
| Stop-Loss | Below 61.8% level |
| Take-Profit 1 | Previous high (0%) |
| Risk/Reward Ratio | 1:3 minimum |
| Confirmation Signal | Bullish engulfing + volume |
Example 2: Setting Targets with Fibonacci Extension
Continuation of the Previous Situation
So, we entered long from the 50% retracement level. Price reached the previous high — first target achieved. But the trend looks strong: volume is increasing, fundamental backdrop is positive. Where to take profits next?

Applying Fibonacci Extension
Step 1: Selecting three points. To build the extension, we need three points:
- Point A — start of the impulse (swing low)
- Point B — end of the impulse (swing high)
- Point C — end of the retracement (our entry point at 50%)
Step 2: Building the levels. Stretch the "Fibonacci Extension" tool through the three points. Projection levels appear on the chart: 61.8%, 100%, 161.8%, 261.8%.
Step 3: Determining targets.
- Target 1 (conservative): 61.8% extension level — take 30-40% of the position here
- Target 2 (moderate): 100% extension level — take another 30% of the position
- Target 3 (aggressive): 161.8% extension level — remaining position
Step 4: Position management. As each target is reached, move the stop-loss to breakeven, then trail it under each new local low. This protects profits while allowing the trend to develop.
Practical Tip
The 161.8% extension level is one of the most "magical" in trading. Significant reversals often occur here. If you see strong resistance at this level — be prepared for a correction.
Example 3: Trading in a Downtrend
Mirror Situation
Fibonacci tools work equally effectively in both directions. Let's examine a bearish market example where we're looking for short entry points.

Situation Analysis
The asset has dropped 60% from its all-time high. After such a decline, an upward correction began. Many beginners think: "This is a reversal! Time to buy!" But an experienced trader asks: "What do the Fibonacci levels say?"
Step 1: Building the grid. In a downtrend, stretch the retracement from high to low (top to bottom). The levels now show how high price can rise within a "counter-trend pullback."
Step 2: Identifying the resistance zone. The 38.2% and 50% levels become potential short entry points. The signal is especially strong if these levels coincide with:
- Previous support levels (which have now become resistance)
- Moving averages (MA 50, MA 200)
- Horizontal volume profile levels
Step 3: Waiting for a reversal pattern. Price reaches the 50% level and forms a bearish "shooting star" candle with a long upper wick. This signals buyer weakness.
Step 4: Entering short. Open a short position after confirmation. Stop-loss — above the 61.8% level. Targets — previous low and extension levels downward.
Long in Uptrend
Build retracement from bottom to top. Buy on pullbacks to 38.2%, 50%, 61.8% levels. Stop below 78.6%.
Short in Downtrend
Build retracement from top to bottom. Sell on pullbacks to 38.2%, 50%, 61.8% levels. Stop above 78.6%.
Example 4: Combining Retracement and Time Zones
Adding the Time Dimension
Price levels tell us where a reversal might occur. But experienced traders also want to know when. This is where Fibonacci time zones come to the rescue.

Building the Analysis
Step 1: Price analysis. Build a standard Fibonacci retracement and identify key levels: 38.2%, 50%, 61.8%.
Step 2: Time analysis. Overlay Fibonacci time zones, anchoring the starting point to a significant extreme (high or low).
Step 3: Finding confluence. The strongest trading signals occur when:
- Price reaches a significant retracement level
- This happens when the current candle is on a time zone vertical line
- A reversal candlestick pattern forms on the chart
Practical case: Price pulled back to the 61.8% retracement level. Simultaneously, the current day corresponds to the 13th Fibonacci time zone. A "morning star" pattern forms on the daily chart. Triple confluence — a powerful buy signal!
| Signal Type | Number of Confluences | Signal Strength |
|---|---|---|
| Price level only | 1 | Weak |
| Price + candlestick pattern | 2 | Moderate |
| Price + time | 2 | Moderate |
| Price + time + pattern | 3 | Strong |
| + confluence with MA/horizontal level | 4+ | Very Strong |
Example 5: Using Fibonacci Fan for Trend Trading
Dynamic Support and Resistance
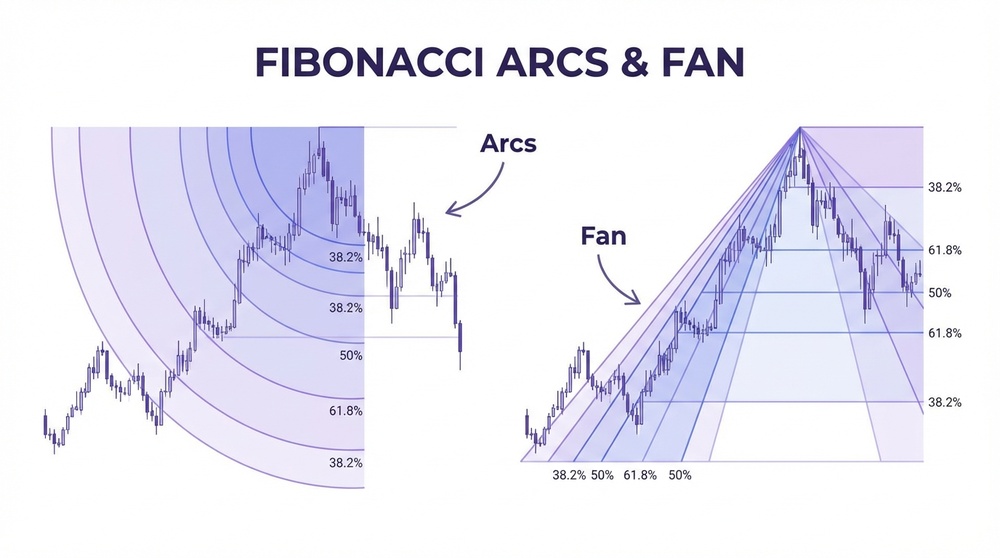
The Fibonacci fan is especially useful in trending markets when price moves in a certain direction for an extended period. The fan rays create dynamic levels that "follow" the price.

Trading Strategy with the Fan
Setting up the fan: In an uptrend, place the fan from a significant low to a significant high. The 38.2%, 50%, and 61.8% rays extend upward, creating a "support ladder."
Entry rules:
- Wait for price to pull back to one of the fan rays
- Observe the reaction: bounce or breakout?
- On a bounce with confirmation (candlestick pattern) — enter long
- On a break of the 38.2% ray — wait for a test of the 50% ray
- A break of the 61.8% ray signals a potential trend reversal
Method advantage: Unlike static horizontal levels, fan rays "grow" with the trend. This allows finding entry points even when price makes new highs and horizontal levels "lag behind."
Example 6: Fibonacci Arcs in a Volatile Market
When Linear Tools Don't Work
The cryptocurrency market is known for its volatility. There are periods when price makes sharp moves, then consolidates in a wide range. In such conditions, Fibonacci arcs can be more effective than linear tools.

Practical Application
Situation: After a sharp pump move, price doesn't fall in a classic pullback but starts "curling" around the high, forming a rounded top.
Solution: Build Fibonacci arcs from the low to the high. The 38.2%, 50%, and 61.8% semicircles create curved support levels that better match the current price dynamics.
Observation: Price bounces off the 38.2% arc several times, not reaching it vertically but touching it along the curve. A classic horizontal retracement would show a breakout, but the arc correctly identifies support.
Important Warning
Arcs are highly dependent on chart scale. Be sure to lock your display settings before analysis and use a logarithmic scale on higher timeframes.
Example 7: Multi-Timeframe Analysis
The Power of Level Alignment
One of the most powerful methods of applying Fibonacci is analyzing multiple timeframes simultaneously. When levels from different timeframes coincide, a "cluster" forms — a zone of special significance.

Analysis Methodology
Step 1: Weekly chart (higher timeframe). Determine the global trend and build a Fibonacci retracement from the main swing low to swing high. Mark key levels: 38.2%, 50%, 61.8%.
Step 2: Daily chart (working timeframe). Build a retracement from the last significant impulse on the daily. Mark its own levels.
Step 3: 4-hour chart (tactical timeframe). Use for precise entry and stop placement.
Step 4: Finding clusters. Look for zones where levels from different timeframes are close to each other. For example:
- 61.8% level from the weekly chart
- 50% level from the daily chart
- 38.2% level from the 4-hour chart
If all three levels are within a 2-3% price range — this is a powerful cluster that will likely become a reversal point.
| Timeframe | Purpose | What We Determine |
|---|---|---|
| Weekly/Monthly | Strategic | Global trend, key levels |
| Daily | Working | Trade direction, main targets |
| 4H/1H | Tactical | Entry points, stop placement |
| 15M/5M | Execution | Precise entry timing |
Example 8: Complex Trading Situation
Putting It All Together
Now let's examine an example where we apply multiple Fibonacci tools simultaneously to make a trading decision.

Initial Data
The asset is in a long-term uptrend. After making a new all-time high, a correction began. Our task is to find the optimal buying point.
Comprehensive Analysis
Tool 1: Fibonacci Retracement. Build from the last swing low to the all-time high. Identify pullback levels:
- 23.6% — shallow retracement (strong trend)
- 38.2% — normal retracement
- 50% — deep retracement
- 61.8% — "golden" retracement
Tool 2: Fibonacci Fan. Overlay from the same base point. The rays create dynamic support.
Tool 3: Time Zones. Identify potential reversal dates.
Confluence analysis:
- Price approaches the 50% horizontal retracement level
- This level is near the 38.2% fan ray
- The current week corresponds to the 8th time zone
- The 200-day moving average passes through the 50% level
- A previous horizontal resistance level (now support) is also here
Decision: Five factors point to one zone. This is an ultra-strong cluster. Set a limit buy order in this zone.
Trade Management
Entry: Limit buy at the 50% retracement level
Stop-loss: Below the 61.8% level (bullish scenario invalidation)
Targets (Fibonacci extension):
- TP1: Previous high (0% retracement) — take 25%
- TP2: 61.8% extension — take 25%
- TP3: 100% extension — take 25%
- TP4: 161.8% extension — remaining 25%
Risk management:
- Risk per trade: 2% of account
- After reaching TP1: move stop to breakeven
- After reaching TP2: trailing stop under each local low
Practical Fibonacci Application Checklist
Use this checklist before every trade based on Fibonacci levels:
Trader's Checklist
- ☑️ Is the overall trend identified on the higher timeframe?
- ☑️ Are the construction points (swing high/low) correctly chosen?
- ☑️ Is there confluence with other levels (MA, horizontal, other Fib)?
- ☑️ Is a confirmation candlestick pattern present?
- ☑️ Does volume match the expected move?
- ☑️ Is a clear stop-loss level defined?
- ☑️ Is the risk/reward ratio calculated (minimum 1:2)?
- ☑️ Are there any major news events that could break technical analysis?
- ☑️ Does position size comply with risk management rules?
Typical Scenarios and Their Solutions
| Scenario | Action | Comment |
|---|---|---|
| Price bounced from 23.6% | Aggressive entry with tight stop | Sign of a very strong trend |
| Price broke 38.2%, heading to 50% | Wait for reaction at 50% | Normal retracement |
| Bounce from 61.8% with pattern | Entry with standard stop below 78.6% | "Golden" zone — high probability |
| Break of 78.6% | Cancel scenario, look for short | Possible trend reversal |
| Cluster of 3+ levels | Increase position size (within risk management) | High-probability setup |
| Levels don't align | Skip the trade | Better not to trade than to lose |
Practical Exercise
To reinforce the material, complete the following exercise:
- Choose any asset — cryptocurrency, stock, currency pair
- Open three timeframes — weekly, daily, and 4-hour
- Build Fibonacci retracement on each timeframe from the last significant impulse
- Find clusters — zones where levels coincide
- Add a fan on the daily chart
- Mark time zones and identify the nearest potential reversal dates
- Formulate a trading plan: entry point, stop-loss, targets
- Record in your trading journal and track the result
Remember: Mastery comes with practice. Every chart you analyze makes you a better trader. Don't fear mistakes — fear not learning from them.
Conclusion
In this lesson, we broke down eight practical examples of applying Fibonacci tools: from classic retracement to comprehensive multi-timeframe analysis. Key takeaways:
- Fibonacci levels aren't magic — they're a tool for identifying zones of heightened market participant interest
- Confluence is the key to success: the more factors pointing to one level, the stronger it is
- Always wait for confirmation: a level alone is not an entry signal
- Risk management matters more than predictions: proper stop-loss placement protects against losing trades
- Practice builds skill: analyze charts daily, keep a trading journal
In the next and final lesson, we'll examine common mistakes when working with Fibonacci levels and learn how to avoid them. This will help you not repeat other traders' errors and trade more effectively from the start.