Module 10: Common Mistakes When Using Fibonacci Levels in Crypto Trading
Fibonacci tools are a powerful weapon in any trader's arsenal, but only when applied correctly. Unfortunately, most beginners make the same mistakes that lead to losses and disappointment with the method. In this lesson, we'll break down each typical error in detail, explain its causes, and provide practical recommendations for improvement.

Why Traders Make Fibonacci Mistakes
Before diving into specific errors, it's important to understand their nature. Fibonacci levels seem simple: draw a line from the low to the high — and you're done. However, behind this simplicity lies a depth that many underestimate.
Main causes of mistakes:
- Lack of systematic approach — chaotic application of tools without a clear methodology
- Ignoring market context — using Fibonacci without considering trend, volatility, and market phase
- Unrealistic expectations — believing that levels work as precise signals rather than zones of interest
- Insufficient practice — jumping to live trading without backtesting skills on historical data
- Emotional decisions — fitting analysis to match desired outcomes
Important to understand: Fibonacci levels are a probabilistic analysis tool, not a magic formula. Even perfectly drawn levels don't guarantee results. Your goal is to use them to increase the probability of successful trades, not to find the "holy grail."
Mistake #1: Incorrect Selection of Anchor Points
This is the most common and critical mistake. The accuracy of all levels depends on choosing the correct starting and ending points. Wrong anchor points make the entire analysis useless.
Typical Manifestations of This Mistake
❌ Incorrect
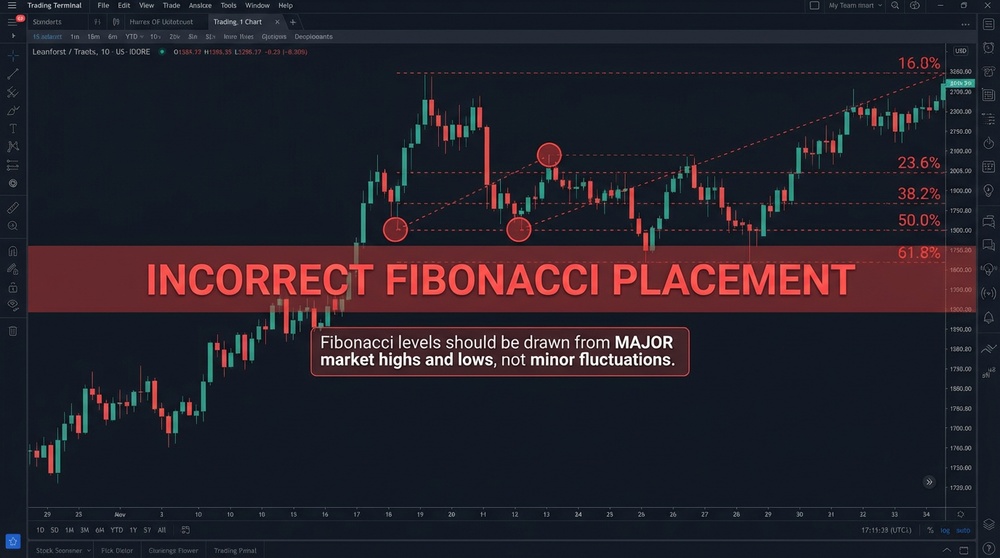
Drawing from intermediate extremes, ignoring candle wicks, choosing random points
✅ Correct
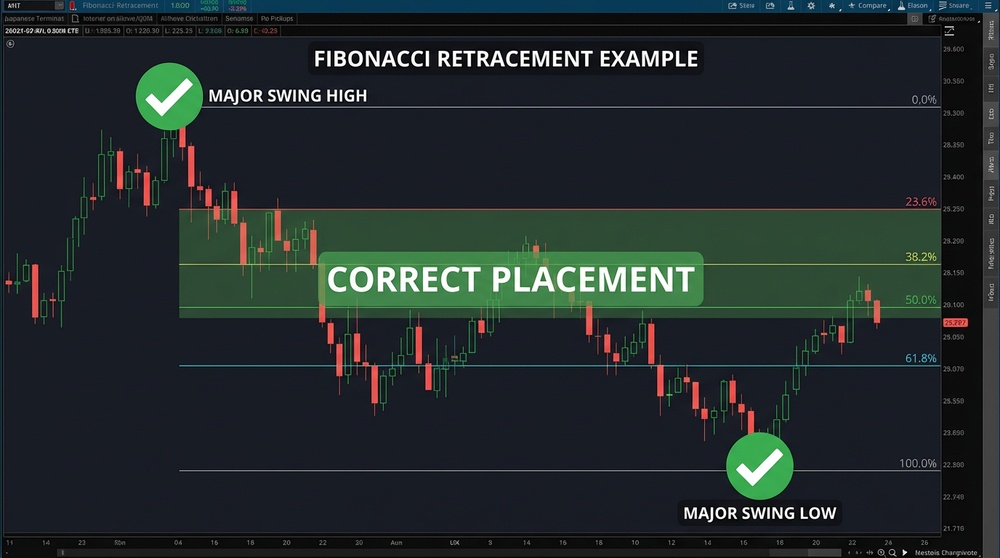
Drawing from significant extremes including wicks, confirmed by volume
Detailed Problem Analysis
Ignoring candle wicks. Many traders draw levels using candle bodies, ignoring the wicks. This is a serious mistake because wicks reflect actual extreme prices where trades occurred. Price actually reached those levels, and that's where large players had their orders.
Choosing insignificant extremes. Not every local minimum or maximum is suitable for drawing. Significant extremes are characterized by:
- Elevated trading volume at the moment of formation
- Clear reversal structure (pin bar, engulfing, double bottom/top)
- Coincidence with support/resistance levels
- Price reaction during subsequent tests
Drawing in the middle of a move. You need to start drawing from the beginning of an impulse move, not from a random point within the trend. If you're unsure where the move begins — increase the timeframe for a clearer picture.
How to Choose Correct Points
- For uptrend: start — absolute low of the move (including wicks), end — absolute high
- For downtrend: start — absolute high, end — absolute low
- Verification: if changing the point by a few candles significantly changes the levels — reconsider your choice
- Confirmation: significant extremes are usually visible across multiple timeframes
Mistake #2: Ignoring Trend and Market Context
Fibonacci levels don't exist in a vacuum. Their effectiveness directly depends on market context. Applying the tool without considering the current market phase is a path to losses.

When Fibonacci Works Best
| Market Phase | Fibonacci Effectiveness | Recommendations |
|---|---|---|
| Strong trend | High | Use 38.2% and 50% retracements for trend entries |
| Weak trend | Medium | Expect deep retracements to 61.8% and 78.6% |
| Sideways (range) | Low | Better to use horizontal support/resistance levels |
| High volatility | Variable | Widen zones, use larger timeframes |
| News events | Low | Avoid trading during major announcements |
Typical Context Errors
Trading retracements in a range. Without a clear trend, Fibonacci levels lose their power. Price moves chaotically, and "retracements" turn out to be just random fluctuations within the range.
Ignoring trend strength. In a strong trend, price rarely retraces deeper than 50%. If you're waiting for a pullback to 78.6% in a powerful bull run — you'll likely miss the entry opportunity.
Neglecting fundamental factors. Technical analysis doesn't work in isolation. Important news, regulatory changes, and major events can completely ignore technical levels.
Practical tip: Before drawing Fibonacci levels, always answer three questions: 1) What's the current trend? 2) How strong is it? 3) Are there upcoming events that could change the picture?
Mistake #3: Using Fibonacci as the Only Tool
One of the most dangerous mistakes is relying exclusively on Fibonacci levels for trading decisions. This is an analysis tool, not a trading system.

Why Fibonacci Alone Isn't Enough
- Probabilistic nature: levels show zones of potential interest, not exact reversal points
- Subjectivity in drawing: different traders may get different levels
- No timing information: the level doesn't tell you when the reaction will occur
- No volume data: levels don't account for market participant activity
What to Combine with Fibonacci
Confirmation Tools
- Horizontal support/resistance levels — coincidence with Fibonacci level strengthens the zone
- Moving averages — dynamic support/resistance levels
- Volume indicators — confirmation of participant interest
- RSI, MACD — overbought/oversold signals and divergences
- Candlestick patterns — reversal patterns at key levels
- Trendlines — intersection with Fibonacci levels creates strong zones
The Confluence Principle
The confluence concept is key to effective Fibonacci use. The more independent tools pointing to the same level, the higher the probability of price reaction.
Example of strong confluence:
- 61.8% Fibonacci level from the last move
- Coincides with historical support level
- Passes near the 200-period moving average
- RSI shows oversold conditions
- Bullish candlestick pattern forming (pin bar, engulfing)
Such confluence gives a significantly higher probability of a successful trade than simply reaching a Fibonacci level.
Mistake #4: Incorrect Timeframe Selection
Timeframe critically affects the significance of Fibonacci levels. Many traders either use timeframes that are too small or ignore multi-timeframe analysis.

Timeframe Hierarchy
| Timeframe | Level Significance | Application |
|---|---|---|
| Monthly (1M) | Maximum | Long-term investment levels |
| Weekly (1W) | Very high | Medium-term trading, swing trading |
| Daily (1D) | High | Main working timeframe for most traders |
| 4-hour (4H) | Medium | Entry refinement, short-term trading |
| 1-hour (1H) | Moderate | Intraday trading, precise entries |
| 15-minute and below | Low | Scalping, requires significant experience |
Typical Timeframe Errors
Trading on small timeframes without considering larger ones. Levels on a 5-minute chart may contradict daily chart levels. Always start analysis from the larger timeframe and move to smaller ones.
Ignoring level coincidence. If the 50% level on the daily chart coincides with the 61.8% level on the 4-hour — this is a reinforced zone deserving special attention.
Too frequent redrawing. On small timeframes, there's a temptation to constantly redraw levels. This creates confusion and leads to "analysis paralysis."
The Three Timeframe Rule
- Higher timeframe: determining overall trend and key levels
- Middle timeframe: drawing working Fibonacci levels
- Lower timeframe: finding precise entry and confirming signals
- Example: D1 → H4 → H1 or W1 → D1 → H4
Mistake #5: Treating Levels as Exact Lines
One of the fundamental mistakes is expecting exact price reaction to a level. Traders place orders exactly on the level and are surprised when price passes slightly above or below.

Why Levels Are Zones
- Market noise: price always fluctuates around significant levels
- Different drawing points: traders use slightly different anchor points
- Stop hunting: large players intentionally "break" obvious levels
- Slippage: in real trading, execution is rarely perfect
How to Properly Work with Zones
Determining zone width. Zone width depends on instrument volatility and timeframe. For cryptocurrencies, it's reasonable to use a zone of ±1-2% from the exact level on the daily chart.
Order placement. Instead of placing a limit order exactly on the level:
- For buying — place the order slightly below the level
- For selling — place the order slightly above the level
- Use multiple orders within the zone (averaging)
Stop-losses. Place stop-loss beyond the zone, not immediately behind the level. Account for typical slippage and market noise.
Practical recommendation: Instead of a single line, draw a zone between adjacent levels or use ATR (Average True Range) to determine adequate zone width in the current market.
Mistake #6: Too Many Levels on the Chart
When multiple Fibonacci drawings from different timeframes and moves are displayed simultaneously, "analysis paralysis" occurs. Too much information hinders decision-making.

Signs of Chart Overload
- More than 3-4 Fibonacci drawings simultaneously
- Levels overlap each other, creating confusion
- Unable to quickly identify key zones
- Every price movement touches some level
- Difficult to make decisions due to conflicting signals
How to Maintain Chart Clarity
Clean Chart Rules
- One timeframe — one main drawing: choose the most relevant move
- Remove outdated levels: if price has moved significantly away from levels — redraw
- Focus on confluence: mark only zones where multiple levels coincide
- Use color coding: different colors for different timeframes
- Apply the materiality principle: keep only levels you actually use
Practical Approach
Optimal chart setup for working with Fibonacci:
- One main drawing from the current significant move
- Optionally — one additional from a larger timeframe
- Confluence zone markings with rectangles or highlighting
- Removal of intermediate levels — keep only 38.2%, 50%, 61.8%
Mistake #7: Ignoring Volume and Market Structure
Fibonacci levels are a purely price-based tool. They don't account for trading volume, which is a key indicator of move strength and reversal probability.

Why Volume Matters
Volume shows participant interest. High volume at a Fibonacci level indicates a real "battle" between buyers and sellers happening there. Low volume may indicate a false move.
Volume confirms or refutes the level. If price reaches the 61.8% level on low volume — it's a weak signal. If volume spikes sharply — the level is significant to the market.
How to Integrate Volume Analysis
| Situation | Interpretation | Action |
|---|---|---|
| Approaching level on rising volume | Strong interest, possible reversal | Prepare for entry, wait for confirmation |
| Approaching level on falling volume | Weak interest, possible breakout | Be cautious, wait for reaction |
| Bounce from level on high volume | Level confirmation | Enter trade with confidence |
| Breakout of level on high volume | True breakout | Look for next level |
| Breakout of level on low volume | Possible false breakout | Wait for price return |
Volume Profile
Advanced traders use volume profile in combination with Fibonacci. If a Fibonacci level coincides with a High Volume Node — it's a very strong zone. If the level is in a Low Volume Node — price may pass through it quickly.
Mistake #8: Trading Against the Trend on Retracement Levels
Fibonacci retracement levels are designed for finding entry points with the trend, not against it. Attempting to catch trend reversals on retracement levels is a common cause of losses.

Trend Trading Logic
When the market is in an uptrend and price pulls back to the 50% level — this is an opportunity to buy cheaper expecting trend continuation. This is NOT a signal for a short position.
Many beginners do the opposite: they see a pullback, consider it a "drop," and open a short position, trading against the dominant trend.
When Counter-Trend Trading Is Acceptable
Conditions for Counter-Trend Trading
- Fibonacci extensions: use 127.2%, 161.8% levels to find reversals after impulse completion
- Multiple confluence: minimum 3-4 independent reversal signals
- Candlestick patterns: strong reversal patterns (evening star, bearish engulfing)
- Divergences: price and indicator divergence (RSI, MACD)
- Reduced position size: risk no more than 0.5% of account
Rule of Thumb
If you can't clearly explain why the trend should reverse right now — don't trade against it. "Price has risen too high" is not an argument. Markets can remain "irrational" longer than you can remain solvent.
Mistake #9: Lack of Risk Management Plan
Even perfect Fibonacci analysis is useless without proper risk management. Many traders focus on finding the "perfect entry" while ignoring exits and position sizing.

Critical Risk Management Errors
- No stop-loss: "Price will come back" — the path to margin call
- Stop-loss at obvious level: right behind the Fibonacci level where it's easy to "hunt"
- Position size too large: desire to "recover" previous losses
- Adding to losing position: averaging without a plan
- No take-profit: greed and fear of missing profits
Integrating Fibonacci into Risk Management
| Element | Fibonacci Usage | Recommendation |
|---|---|---|
| Stop-loss | Beyond next Fibonacci level + buffer | Entry at 50% → stop beyond 78.6% (not at 61.8%) |
| Take-profit 1 | Previous extreme (0% or 100%) | Close 50% of position, move stop to breakeven |
| Take-profit 2 | Extension 127.2% or 161.8% | Close remaining position |
| Position size | Calculate from distance to stop | Risk no more than 1-2% of account per trade |
Position Size Formula
Position Size = (Account × Risk%) ÷ (Entry Price - Stop-Loss)
Example: Account $10,000, risk 1%, entry at $100, stop at $95
Size = ($10,000 × 0.01) ÷ ($100 - $95) = $100 ÷ $5 = 20 units of asset
Mistake #10: Psychological Traps
Technical analysis is only half the battle. The other half is psychology. Even experienced traders fall into emotional traps when working with Fibonacci.

Main Psychological Errors
1. Confirmation Bias. You want to buy an asset and "find" Fibonacci levels confirming your idea. You subconsciously choose drawing points that give the "needed" levels.
2. Overconfidence after successes. Several successful Fibonacci trades create an illusion of "understanding the market." The trader increases risks and ignores warning signals.
3. Fear of Missing Out (FOMO). Price approaches a level, and the trader enters prematurely without waiting for confirmation. Or enters with too large a position, fearing to "miss" the move.
4. Loss aversion. The trade goes against you, but you don't close it, hoping for a "return to level." Instead, you draw new levels justifying holding the position.
5. Revenge trading. After a losing trade on a Fibonacci level, the trader immediately opens a new trade in the opposite direction, trying to "get even."
How to Combat Psychological Traps
Practical Recommendations
- Keep a trading journal: record not only trades but also emotions
- Create a checklist: verify each trade against objective criteria
- Set rules BEFORE entry: stop, target, position size
- Take breaks: after a losing trade — minimum 1 hour without trading
- Use a demo account: for testing new strategies
- Limit losses: daily loss limit (e.g., 3% of account)
Checklist: Pre-Trade Verification for Fibonacci Trades
Use this checklist for every trade based on Fibonacci levels. A "no" answer to any question is a reason to reconsider your decision.
| # | Question | ✓ |
|---|---|---|
| 1 | Is the current trend identified on the higher timeframe? | ☐ |
| 2 | Are significant anchor points chosen (not intermediate extremes)? | ☐ |
| 3 | Are candle wicks accounted for in the drawing? | ☐ |
| 4 | Is there confluence with other tools (levels, MA, indicators)? | ☐ |
| 5 | Am I trading with the trend, not against it? | ☐ |
| 6 | Is stop-loss set beyond the next level + buffer? | ☐ |
| 7 | Is the target (take-profit) defined? | ☐ |
| 8 | Is the risk/reward ratio at least 1:2? | ☐ |
| 9 | Does position size comply with risk management rules? | ☐ |
| 10 | Am I in a calm emotional state? | ☐ |
| 11 | Are there no major news events coming up soon? | ☐ |
| 12 | Can I afford to lose the risk amount? | ☐ |
Summary: How to Avoid Fibonacci Mistakes
Let's summarize and formulate the key principles for proper Fibonacci level usage:
❌ Avoid
- Random selection of anchor points
- Ignoring market context
- Using only Fibonacci
- Expecting exact reaction to level
- Overloading chart with levels
- Trading against the trend
- Neglecting risk management
- Emotional decisions
✅ Practice
- Choosing significant extremes
- Multi-timeframe analysis
- Seeking tool confluence
- Working with zones, not lines
- Clean, readable chart
- Trading with the trend
- Strict risk management
- Keeping a trading journal
Final thought: Fibonacci levels are not a magic wand but a probabilistic analysis tool. Their purpose is to help you find zones of potential market interest and make more informed decisions. Success comes with practice, discipline, and continuous learning. Don't be discouraged by mistakes — each one makes you a better trader.
Congratulations on Completing the Course!
You've completed all 10 lessons of the Fibonacci levels course. Now you have the theoretical foundation and practical knowledge to apply this powerful tool in real trading.
Next steps:
- Practice on a demo account for at least 2-4 weeks
- Keep a trading journal and analyze your mistakes
- Start with small amounts when transitioning to a live account
- Continue learning — study related technical analysis topics
- Return to course lessons to review the material
Good luck in trading and remember: consistency and discipline are more important than any analysis tool!