Module 8: Timeframes: How to Read Candlesticks on Different Periods
Why Does the Same Chart Look Different?
Picture this: you open a Bitcoin chart on the 15-minute timeframe and see a powerful uptrend. Excitedly, you open a long position... An hour later, you discover that on the daily chart, it was just a minor correction within a global downtrend. Sound familiar? This classic rookie mistake has cost traders millions of dollars.
Timeframe — is the time interval that one candle represents on a chart. A single candle on an hourly chart contains information about price movement for an entire hour. The same candle on a minute chart shows only 60 seconds of trading. Understanding this difference is the foundation of professional trading.
Key Principle: Each timeframe tells its own market story. Lower timeframes show tactics, higher ones — strategy. Mastery lies in the ability to read both stories simultaneously.

Classification of Timeframes in Crypto Trading
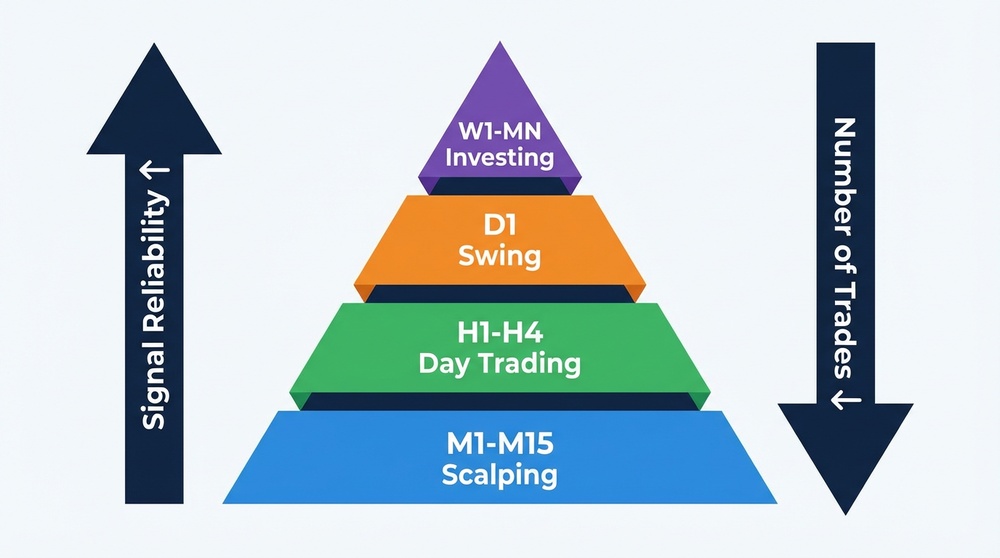
All time intervals are conventionally divided into three major groups. Each group suits a specific trading style and has its own characteristics for candlestick pattern formation.
Lower Timeframes (M1 — M30)
This is the trader's "microscope." Minute and five-minute charts show the smallest price fluctuations, every volume spike, every micro-reaction of the market to news.
Characteristics of Lower Timeframes
- M1 (1 minute) — one candle = 60 seconds. Maximum "noise," used by scalpers
- M5 (5 minutes) — the gold standard for scalping, fewer false signals
- M15 (15 minutes) — balance between detail and pattern reliability
- M30 (30 minutes) — transitional timeframe, suitable for intraday trading
Medium Timeframes (H1 — H4)
Hourly charts are the working tool of most active traders. Reliable candlestick patterns form here, and market noise is significantly reduced.
Characteristics of Medium Timeframes
- H1 (1 hour) — optimal for intraday trading, clear support/resistance levels
- H4 (4 hours) — favorite timeframe of swing traders, high signal reliability
Higher Timeframes (D1 — MN)
Daily, weekly, and monthly charts show the global market picture. A single candle here can contain thousands of trades and reflect the sentiment of large institutional players.
Characteristics of Higher Timeframes
- D1 (1 day) — foundation of long-term analysis, most reliable patterns
- W1 (1 week) — shows medium-term trends, ideal for position traders
- MN (1 month) — macro market picture, used by investors

Anatomy of a Candle on Different Timeframes
This is where the real magic of market understanding begins. A single daily candle isn't just a rectangle with shadows. It's a compressed story of all events that occurred during 24 hours of trading.
How a Daily Candle Forms
Imagine you're watching the formation of one daily bullish candle:
| Time | What Happens | How It Reflects on D1 |
|---|---|---|
| 00:00 — 06:00 | Asian session: low volatility, sideways movement | The candle's open and lower shadow form |
| 06:00 — 14:00 | European session: increased activity, level breakout | The candle body starts growing |
| 14:00 — 21:00 | American session: maximum volume, impulse movement | The main body and upper shadow form |
| 21:00 — 00:00 | Activity fades, profit-taking | The candle's closing price is determined |
Important Understanding: When you see a "Hammer" on a daily chart, behind this single candle may hide an entire drama — panic selling in the morning, reversal at midday, and confident recovery by evening. This story can be "read" by dropping down to lower timeframes.
Pattern Transformation Between Timeframes
One of the most powerful insights in candlestick analysis: a pattern on a higher timeframe consists of multiple candles on a lower one. And vice versa — chaotic movement on M5 can fold into a perfect reversal pattern on H4.
📊 On M15: 12 candles
We see chaotic movement: several red candles, then green ones, long shadows — hard to determine direction
📈 On H4: 1 "Hammer" candle
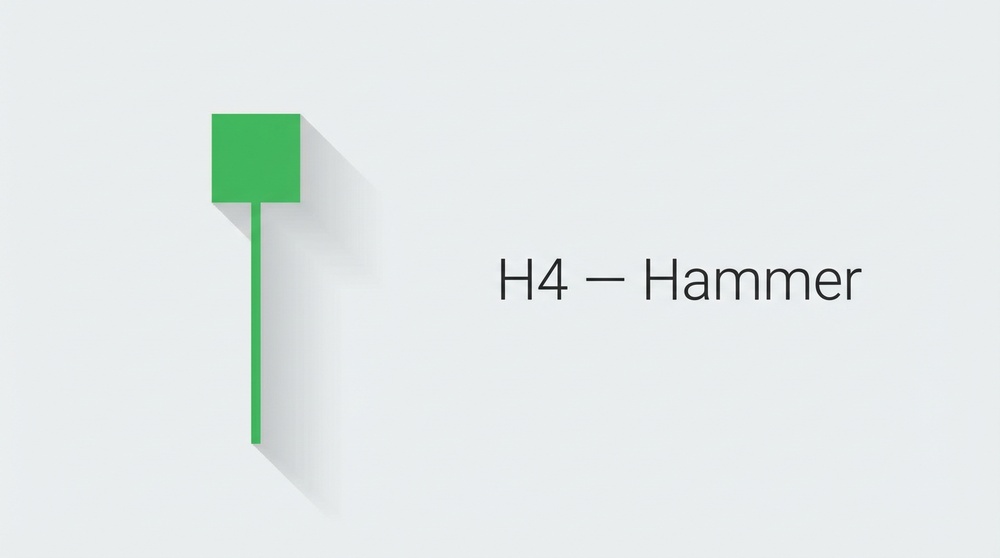
Those same 12 fifteen-minute candles folded into a classic bullish Hammer — a powerful reversal signal
Multi-Timeframe Analysis: The Triple Screen Method
Legendary trader Alexander Elder developed the "Triple Screen" system, which became the gold standard of professional analysis. The essence of the method: analyze the market sequentially on three connected timeframes.
How the System Works
Three Levels of Analysis
- Screen 1 (Strategic) — the higher timeframe determines the global trend. Trade ONLY in its direction
- Screen 2 (Tactical) — the medium timeframe looks for corrections against the trend for entry
- Screen 3 (Entry Point) — the lower timeframe determines the optimal moment to open a position
Choosing a Timeframe Combination
Timeframes should be connected by a multiplier of approximately 4-6. This provides sufficient difference in perspective while maintaining a logical connection between levels.
| Trading Style | Screen 1 (trend) | Screen 2 (correction) | Screen 3 (entry) |
|---|---|---|---|
| Scalping | M30 or H1 | M5 | M1 |
| Day Trading | H4 | H1 | M15 |
| Swing Trading | D1 | H4 | H1 |
| Position Trading | W1 | D1 | H4 |

Practical Analysis Algorithm
Let's break down a step-by-step analysis process you can apply today. We'll use the popular day trading combination: D1 → H4 → H1.
Step 1: Determine the Global Trend (D1)
Open the daily chart and answer these questions:
- Where is the price relative to key levels?
- What candlestick patterns have formed over the last 5-10 days?
- Is there a clear trend or is the market in consolidation?
Rule: If D1 shows a bullish trend — consider ONLY buys. Bearish trend — ONLY sells. Sideways — either don't trade or work from range boundaries.
Step 2: Find the Entry Zone (H4)
Switch to the 4-hour chart and look for:
- Pullbacks to support levels (during a bullish trend on D1)
- Formation of reversal patterns: Hammer, Engulfing, Morning Star
- Price reaction to moving averages or trend lines
Step 3: Choose the Entry Point (H1)
On the hourly chart, determine:
- Specific level for placing a limit order
- Confirming candlestick pattern
- Optimal stop-loss placement (beyond the nearest local extreme)
Example in Action
D1: Bitcoin in an uptrend, price pulled back to the 200 EMA
H4: Bullish Engulfing candle formed from support level
H1: After a small consolidation, a Hammer appeared — signal to enter long
Stop-loss: below the Hammer's shadow on H1. Take-profit: previous high on H4.

Candlestick Characteristics on Different Timeframes
Not all candlestick patterns are equally reliable on different time intervals. Understanding these nuances is critically important for signal filtering.
Pattern Reliability by Timeframe
| Pattern | M5-M15 | H1-H4 | D1 and above |
|---|---|---|---|
| Doji | ⚠️ Many false signals | ✅ Moderate reliability | ✅✅ High reliability |
| Hammer/Hanging Man | ⚠️ Requires confirmation | ✅ Good signals | ✅✅ Strong signals |
| Engulfing | ✅ Works with volume | ✅✅ Excellent reliability | ✅✅ Very strong signal |
| Morning/Evening Star | ❌ Too much noise | ✅ Reliable pattern | ✅✅ Powerful reversal signal |
| Three Soldiers/Crows | ⚠️ Rarely forms cleanly | ✅ Good continuation signal | ✅✅ Trend confirmation |
Golden Rule: The higher the timeframe, the more reliable the candlestick pattern. One Hammer on a daily chart "weighs" more than ten Hammers on a five-minute chart.
What Happens with Volume
Volume is a critical filter for candlestick signals. On different timeframes, volume is interpreted differently:
- Lower TFs: Volume spikes are often related to short-term news or manipulation. Look for abnormal volume at key levels
- Medium TFs: Volume confirms pattern strength. Engulfing on high volume — strong signal
- Higher TFs: Daily or weekly volume shows "smart money" activity. Volume increase in trend direction — its confirmation
Choosing a Timeframe for Your Trading Style
There's no "best" timeframe. There's a timeframe that matches your psychology, available time, and risk tolerance.
⚡ Scalping (M1-M15)
For whom: Traders with quick reactions, high stress tolerance, and ability to watch the market all day
Pros: Many opportunities, quick results
Cons: High fees, emotional burnout, many false signals
📈 Swing Trading (H4-D1)
For whom: Traders with a main job who prefer quality over quantity of trades
Pros: Reliable signals, less stress, time for analysis
Cons: Requires patience, positions held for days/weeks

Common Mistakes When Working with Timeframes
Even experienced traders make these mistakes. Knowing them in advance will help you avoid losing your deposit.
Mistake #1: Trading Against the Higher Trend
You see a perfect bullish Hammer on H1 and open a long. But on D1 — there's a bearish Engulfing and a key support breakout. Your Hammer will be "swept away" by the global trend.
Solution: Always start analysis from the higher timeframe. If the global picture contradicts the signal on the lower TF — skip the trade.
Mistake #2: Chaotic Timeframe Switching
A trader opens a position based on an H4 signal, but when price goes against them, starts looking for "confirmation" on M5. Finds some pattern and holds the losing position. This is self-deception.
Solution: Define your working timeframes BEFORE entering a trade and stick to them. If you trade on H4 — close on H4.
Mistake #3: Ignoring Context
A Hammer on M15 in the middle of a powerful trend on H4 — is not a reversal, but a pause. The same Hammer at a key support level on D1 — is a completely different matter.
Solution: A candlestick pattern only has meaning in context. Always ask the question: "Where is this pattern forming?"
Pre-Trade Checklist
- Checked trend direction on higher TF?
- Pattern on working TF matches global direction?
- Is there volume confirmation?
- Did the pattern form at a significant level?
- Is risk/reward ratio at least 1:2?
Timeframe Synchronization: When Signals Strengthen
The most powerful trading setups occur when signals on multiple timeframes align. This is called confluence (merging) of factors.
Ideal Entry Scenario
- D1: Uptrend, price pulled back to support level, bullish Hammer formed
- H4: Bullish Engulfing at the same level, volume above average
- H1: Local resistance breakout, candle closed above the level
When three timeframes "say" the same thing — the probability of a successful trade increases dramatically. Such setups don't happen every day, but they're what bring the main profit.
Professional Approach: It's better to make 5 trades per month with high probability of success than 50 trades with questionable signals. Patience and discipline are your main allies.
Practical Assignment
Theory without practice is dead. Complete this exercise to reinforce the material:
- Choose any cryptocurrency pair from the top 10 by market cap
- Open the daily chart and determine the current trend (bullish, bearish, sideways)
- Switch to H4 and find the last 3 candlestick patterns you studied in previous lessons
- Drop down to H1 and see how these patterns "looked" at the moment of formation
- Write in your trading journal: which patterns worked out, which didn't, and why
Repeat this exercise daily for a week. You'll be surprised how quickly you start "seeing" the market differently.
Key Takeaways from This Lesson
- Timeframe is a lens through which you look at the market. Different lenses show different pictures
- Higher timeframe determines direction, medium — entry zone, lower — entry point
- Pattern reliability increases with higher timeframes
- Multi-timeframe analysis is an essential skill for professional traders
- Signal confluence across multiple TFs creates high-probability setups
- Choose a timeframe that matches your trading style and psychology, not the other way around
In the next lesson, we'll move on to practical strategies: learn to identify specific entry and exit points using everything we've studied in the course. You'll get ready-made trading systems you can apply today.