Module 2: Candlestick Anatomy: Body, Shadows, and What They Mean
Before recognizing complex patterns and combinations, you need to learn how to read each individual candle like an open book. Every element — body, upper shadow, lower shadow — carries information about the battle between buyers and sellers. Understanding candlestick anatomy is the foundation without which building a profitable trading system is impossible.
In this lesson, you'll discover how each part of a candle forms, what it means from a market psychology perspective, and how to use this knowledge to analyze any asset — from Bitcoin to altcoins.
What Makes Up a Japanese Candlestick
Each candle on a chart is a visual representation of four key prices over a specific time period:
- Opening Price (Open) — the price of the first trade at the beginning of the period
- Closing Price (Close) — the price of the last trade at the end of the period
- High — the highest price during the period
- Low — the lowest price during the period
These four values form three visual elements of the candle: the body, upper shadow, and lower shadow.

Candle Body: The Heart of Price Action
The candle body is the rectangle between the opening and closing prices. It's the main element that instantly shows who won during that period — bulls or bears.
Bullish Candle (Rising)
When the closing price is higher than the opening price, a bullish candle forms. On most platforms, it's displayed in green or white. The body shows the range by which the price increased during the period.
🟢 Bullish Candle

Open at the bottom, close at the top. Buyers controlled the situation and pushed the price above the initial level.
🔴 Bearish Candle

Open at the top, close at the bottom. Sellers dominated and pushed the price below the initial level.
Bearish Candle (Falling)
When the closing price is lower than the opening price, a bearish candle forms. It's usually red or black. The body shows the magnitude of the price decline during the period.
Important to understand: The candle color doesn't show the overall trend direction, only the result of that specific period. Even in a strong uptrend, red candles will appear — this is normal correction.
Upper Shadow (Upper Wick)
The upper shadow is the vertical line above the candle body, connecting the top edge of the body to the period's high. It shows how high the price rose before pulling back.
What the Upper Shadow Reveals
- Long upper shadow — buyers tried to push the price higher, but sellers resisted and "pushed" the price back down
- Short upper shadow — minimal seller resistance at the highs
- No upper shadow — the candle closed at the high (for bullish) or opened at the high (for bearish), indicating strong pressure in one direction

Practical Insight
A long upper shadow in a resistance zone is a warning signal. It shows that there are large sellers at these levels ready to defend their positions. Pay special attention to such candles after a prolonged rally.
Lower Shadow (Lower Tail)
The lower shadow is the vertical line below the candle body, connecting the bottom edge of the body to the period's low. It shows how low the price dropped before buyers brought it back up.
What the Lower Shadow Reveals
- Long lower shadow — sellers pushed the price down, but buyers showed strength and bought the dip, returning the price higher
- Short lower shadow — minimal buyer activity at the lows
- No lower shadow — the candle opened at the low (for bullish) or closed at the low (for bearish), indicating one side's dominance

Remember: A long lower shadow in a support zone is a sign that buyers are actively defending that level. The longer the shadow, the stronger the buying pressure was.
Candle Body Size and Its Significance
The candle body size directly reflects the strength and confidence of market participants. Learning to read sizes will help you assess movement momentum.
| Body Size | Characteristic | What It Means |
|---|---|---|
| Large body | Takes up a significant portion of the High-Low range | Strong momentum, confident movement, high volatility. One side completely dominates |
| Medium body | Approximately 50% of the total candle range | Moderate activity, there's a battle, but there's a clear winner for the period |
| Small body | Takes up a small portion of the range | Market indecision, balance of power between buyers and sellers |
| No body (Doji) | Open equals or nearly equals close | Complete indecision, potential reversal or pause in trend |

Body-to-Shadow Ratio: The Key to Understanding the Market
Experienced traders analyze not individual elements, but the ratio between body and shadows. This provides deeper insight into market dynamics.
Candle with Large Body and Short Shadows
Such a candle is called a Marubozu. It signals:
- Strong buying pressure (bullish) or selling pressure (bearish)
- Lack of serious resistance from the opposite side
- High probability of continuation
Bullish Marubozu

Open at the low, close at the high. Buyers controlled the entire period without pullbacks.
Bearish Marubozu

Open at the high, close at the low. Sellers controlled the entire period without pullbacks.
Candle with Small Body and Long Shadows
Such candles are called Spinning Tops or can be variations of Doji. They indicate:
- Uncertainty and struggle in the market
- Possible exhaustion of the current trend
- Decision zone — the market is "thinking"

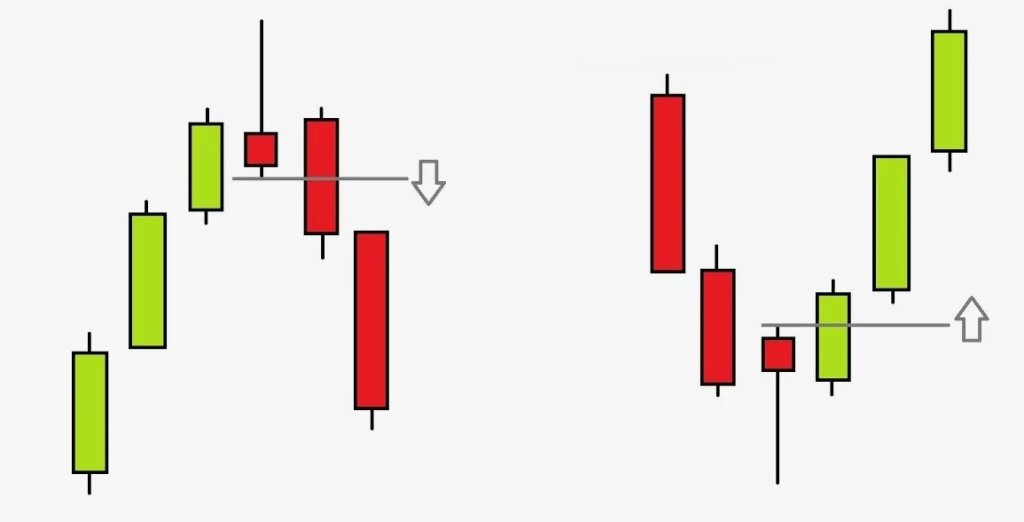
Candle with Long Shadow on One Side
If one shadow is significantly longer than the other and the body, it signals rejection of a certain price level:
- Long upper shadow + small body at the bottom — "Shooting Star" or "Inverted Hammer" (depending on context). The market rejected higher prices
- Long lower shadow + small body at the top — "Hammer" or "Hanging Man" (depending on context). The market rejected lower prices

How to Read Candle Size in Context
Candle size is always evaluated relative to previous candles, not in absolute values. A large candle is one that significantly exceeds the average size of the last 10-20 candles on the chart.
- Sharp size increase — volatility spike, possibly an important event
- Gradual decrease — trend exhaustion, consolidation
- Stable size — steady trending movement
Practical Algorithm for Reading a Candle
When you look at any candle, ask yourself these questions sequentially:
- What color is the candle? — Determine who won: bulls or bears
- What is the body size? — Assess the winner's strength: confident victory or barely
- Is there an upper shadow and how long is it? — Was there resistance to the rise
- Is there a lower shadow and how long is it? — Was there defense against the decline
- Where is the candle relative to previous ones? — Context: trend, level, pattern

Common Mistakes in Candlestick Analysis
Avoid these common beginner trader mistakes:
- Analyzing candles in isolation — one candle without context means nothing. Always consider position on the chart, trend, and key levels
- Ignoring timeframe — a candle on a 1-minute chart and on a daily chart carry completely different weight
- Overvaluing shadows — not every long shadow means reversal. Look for confirmation
- Neglecting volume — a candle without considering volume gives an incomplete picture
Professional rule: Never make a trading decision based on a single candle. Look for confirmation in subsequent candles, volume, and overall market context.
Checklist: Candlestick Anatomy
Save this checklist for quick review:
| Element | What It Shows | What to Pay Attention To |
|---|---|---|
| Body | Difference between open and close | Color (direction), size (movement strength) |
| Upper Shadow | Period high vs. top of body | Length indicates resistance to upward movement |
| Lower Shadow | Period low vs. bottom of body | Length indicates buying of the dip |
| Total Range | High - Low for the period | Period volatility, participant activity |
What's Next
Now you know how to read each element of a Japanese candlestick. This is a critically important skill you'll use when analyzing any patterns. In the next lesson, we'll study reversal candles — Doji, Hammer, Shooting Star — and learn to find potential trend change points.
Before moving on, open a chart of any cryptocurrency and analyze the last 20 candles using the algorithm from this lesson. Practice is the key to mastery.