Module 4: Engulfing Patterns and Stars (Bullish and Bearish)
Engulfing Patterns and Stars: The Key to Trend Reversals
Imagine this scenario: the market has been falling for several days straight, traders are panic selling, and suddenly one candle appears that completely changes the balance of power. Price reverses and begins a powerful rally. How can you recognize such a moment in advance? The answer lies in engulfing patterns and stars.
These candlestick patterns are among the most reliable reversal signals in technical analysis. Japanese rice traders used them over 300 years ago, and today they work on cryptocurrency markets with the same effectiveness. In this lesson, you'll learn not just to recognize these patterns, but to understand the market psychology behind each candle.
Key Lesson Takeaway: Engulfing patterns and stars are the "fingerprints" of major players. When you see these formations, you're witnessing the moment when "smart money" changes the market's direction.
Part 1: Engulfing Patterns — When One Candle Defeats Another
What Is an Engulfing Pattern?
The Engulfing Pattern is a two-candle formation where the body of the second candle completely covers (engulfs) the body of the first. This pattern signals a sharp shift in market sentiment and a potential trend reversal.
Why is this pattern so important? Because it shows a dramatic change in the balance of power between buyers and sellers. When the second candle completely engulfs the first, it means the new side (bulls or bears) has completely overwhelmed the opposition.

Criteria for a Perfect Engulfing Pattern
- Complete body coverage: The second candle's body must completely "embrace" the first candle's body
- Contrasting colors: The candles must be different colors (bullish and bearish)
- Preceding trend: The pattern forms after a defined price movement
- Increased volume: The second candle should ideally be accompanied by higher volume
Bullish Engulfing
Bullish engulfing appears at the end of a downtrend and signals a potential reversal upward. This pattern consists of a small bearish (red) candle followed by a large bullish (green) candle that completely engulfs the previous candle's body.
Structure of Bullish Engulfing:
- First candle: A small bearish candle confirming the current downtrend
- Second candle: A large bullish candle that opens below the first candle's close and closes above its open
- Context: Forms after at least 3-5 declining candles

Psychology Behind Bullish Engulfing
What happens in the market when this pattern forms?
- Day 1: Bears control the market. Sellers are confident the decline will continue, short positions are opened
- Overnight/morning: Price opens even lower — bears celebrate
- Day 2: Suddenly, powerful buyers appear. They absorb all selling pressure, price surges sharply
- Close: Bulls completely overwhelm bears, closing the candle above the previous day's open
This is the moment of seller capitulation. Those who opened short positions are forced to close them at a loss, further amplifying the rally.
✅ Strong Bullish Engulfing
- Second candle is 2-3 times larger than the first
- Minimal wicks on the bullish candle
- Sharp increase in trading volume
- Forms at a support level
- First candle is a small Doji
⚠️ Weak Bullish Engulfing
- Candles are roughly the same size
- Long wicks on the second candle
- Low or average volume
- Forms in the middle of a range
- No clear preceding trend
Bearish Engulfing
Bearish engulfing is the mirror pattern, appearing at the top of an uptrend. A large bearish candle completely engulfs a small bullish candle, signaling a potential reversal downward.
Structure of Bearish Engulfing:
- First candle: A small bullish candle showing weakening upward momentum
- Second candle: A large bearish candle that opens above the first candle's close and closes below its open
- Context: Forms after sustained upward movement

Psychology Behind Bearish Engulfing
Bearish engulfing is the moment of truth for bulls:
- Euphoria phase: After prolonged growth, traders become overly optimistic
- False hope: The market opens even higher — bulls are confident the rally will continue
- Reality check: Major players begin taking profits, selling their positions
- Panic: Price drops below the previous day's open, triggering a cascade of stop-losses
Practical Observation: Bearish engulfing patterns in the crypto market often form after news-driven "pumps," when price surges sharply on hype, then large holders dump their coins on retail traders.
Trading Engulfing Patterns
| Parameter | Bullish Engulfing | Bearish Engulfing |
|---|---|---|
| Entry Direction | Buy (Long) | Sell (Short) |
| Entry Point | Close of bullish candle or breakout above its high | Close of bearish candle or breakdown below its low |
| Stop-Loss | Below the pattern's low | Above the pattern's high |
| Take-Profit | Nearest resistance level | Nearest support level |
| Risk/Reward Ratio | Minimum 1:2 | Minimum 1:2 |

Part 2: Star Patterns — Three-Candle Reversal Formations
If engulfing patterns are a "two-act play," then star patterns are a full "three-act thriller." These formations consist of three candles and provide more reliable reversal signals because they show the complete cycle: trend → indecision → reversal.
What Is a "Star" in Candlestick Analysis?
A star is a candle with a small body that forms with a gap relative to the previous candle. It symbolizes a moment of equilibrium between bulls and bears, when the market "pauses" before a significant move.
Characteristics of an Ideal Star
- Small body: The star's body should be significantly smaller than the previous candle
- Gap: The star opens with a gap from the previous candle's body
- Color doesn't matter: The star can be any color
- Candle type: Ideally a Doji or a candle with a very small body
Morning Star — Herald of Dawn
The Morning Star is a bullish reversal pattern appearing at the end of a downtrend. The name metaphorically describes Venus appearing in the morning sky, heralding sunrise — similarly, this pattern heralds the "rise" of price.
Structure of the Morning Star:

- First candle (Body): A large bearish candle confirming the strength of the downtrend. Bears are in complete control.
- Second candle (Star): A small candle with a gap down. This is the key moment — selling pressure is exhausted, buyers begin to resist.
- Third candle (Confirmation): A large bullish candle closing at least above the midpoint of the first candle. Bulls have seized control.
The Psychological Drama of the Morning Star
Behind each candle in this pattern lies an entire story:
Act 1 — Despair: The market is falling, news is negative, traders are panic selling. The large red candle is the culmination of fear.
Act 2 — Doubt: In the morning, price opens even lower (gap down), but... nothing happens. Sellers are exhausted. The small star candle is the calm before the storm.
Act 3 — Hope: Buyers, seeing the bears' weakness, begin actively buying the asset. Price surges, forming a large green candle. Those who opened shorts close at a loss, amplifying the rally.
Ideal Morning Star
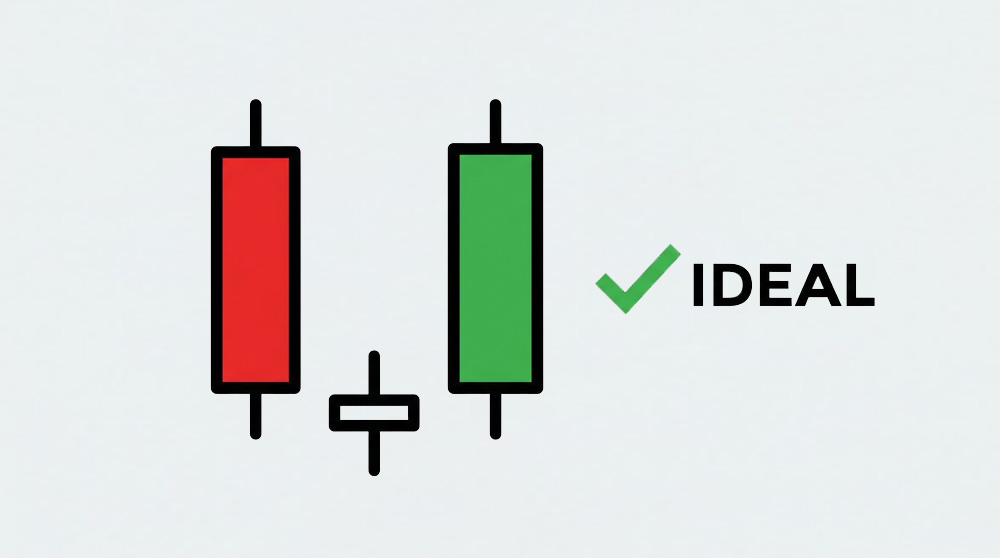
Star is a Doji with gaps on both sides. Third candle closes above the midpoint of the first. High volume on the third candle.
Acceptable Morning Star
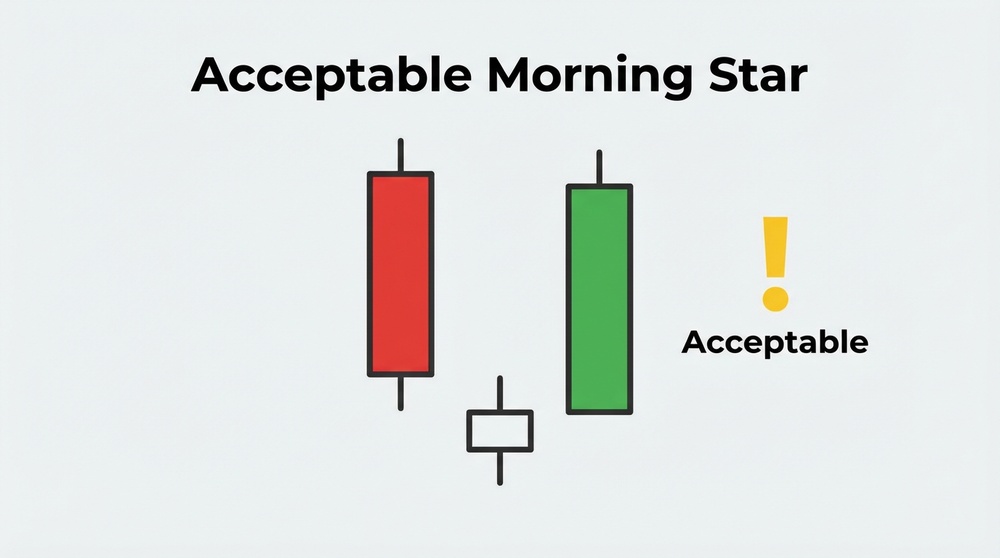
Star with a small body, gap on only one side. Third candle covers more than 50% of the first.
Evening Star — Harbinger of Sunset
The Evening Star is a bearish reversal pattern appearing at the top of an uptrend. Just as the evening star heralds the coming of night, this pattern signals the "sunset" of the bull market.
Structure of the Evening Star:

- First candle: A large bullish candle — bulls dominate, optimism is at its peak
- Second candle (Star): A small candle with a gap up — moment of indecision at the top
- Third candle: A large bearish candle closing below the midpoint of the first — bears have seized control
Psychology Behind the Evening Star
Act 1 — Euphoria: The market is rising, everyone's talking about "moon," FOMO (fear of missing out) is at maximum. The large green candle is peak greed.
Act 2 — The Top: Price opens even higher with a gap, but there's no further growth. Major players begin quietly selling. The small candle is the bulls' last breath.
Act 3 — Reality: Sellers crash the price. Panic builds, stop-losses trigger in cascade. The large red candle confirms: the party is over.
Crypto-Specific Note: In the crypto market, evening stars often form after listings on major exchanges, partnership announcements, or other "positive" news. Classic "buy the rumor, sell the news" scenario.
Special Variations of Star Patterns
Morning/Evening Doji Star
When the middle candle in the pattern is a Doji (open price equals close price), the pattern is called a "Morning/Evening Doji Star." Such formations are considered stronger because the Doji shows absolute equilibrium of forces.

Abandoned Baby
The Abandoned Baby is a rare and very powerful variation of the star pattern where the Doji star has gaps on both sides (its shadows don't touch neighboring candles). This is one of the most reliable reversal signals.
| Pattern | Signal Strength | Frequency | Features |
|---|---|---|---|
| Classic Star | ⭐⭐⭐ | Common | Gap on one side |
| Doji Star | ⭐⭐⭐⭐ | Medium | Center candle is a Doji |
| Abandoned Baby | ⭐⭐⭐⭐⭐ | Rare | Gaps on both sides of Doji |
Part 3: Practical Application of Patterns
Confirmation Filters: How to Avoid False Signals
Even a perfect engulfing pattern or star can be a false signal. To increase the probability of a successful trade, use confirmation filters:
1. Support and Resistance Levels
A pattern formed at a key level has much greater strength:
- Bullish patterns at support level — strong buy signal
- Bearish patterns at resistance level — strong sell signal
- Pattern in "no man's land" (no nearby levels) — requires additional confirmation

2. Volume Analysis
Trading volume is the "fuel" for price movement:
Volume Rules for Patterns
- Engulfing: Volume on the second (engulfing) candle should be above average
- Star: Volume on the star — low, on the third candle — high
- Divergence: If volume doesn't confirm the pattern — be cautious
- Climax: Extremely high volume may indicate a final spike before reversal
3. Overbought/Oversold Indicators
Use oscillators for confirmation:
- RSI below 30 + bullish engulfing/morning star = strong buy signal
- RSI above 70 + bearish engulfing/evening star = strong sell signal
- RSI divergence + candlestick pattern = very strong signal
4. Timeframe
The higher the timeframe, the more reliable the signal:
| Timeframe | Pattern Reliability | Application |
|---|---|---|
| 1-5 minutes | Low (lots of noise) | Only for scalping with additional filters |
| 15-30 minutes | Medium | Intraday trading |
| 1-4 hours | Good | Swing trading |
| Daily | High | Medium-term positions |
| Weekly | Very high | Long-term investments |
Step-by-Step Trading Algorithm
Use this checklist for making trading decisions:
Step 1: Identification
- Determine the current trend (need a clear uptrend or downtrend)
- Find a forming engulfing or star pattern
- Ensure the pattern meets the criteria (correct structure)
Step 2: Confirmation
- Check for support/resistance level
- Evaluate trading volume
- Review indicator readings
- Check the pattern on a higher timeframe
Step 3: Trade Planning
- Determine entry point (conservative or aggressive)
- Calculate stop-loss size
- Set take-profit target levels
- Verify risk/reward ratio (minimum 1:2)
Step 4: Execution
- Wait for pattern completion
- Open position according to plan
- Set stop-loss immediately after entry
- Don't move stop-loss against your position

Common Mistakes When Trading Patterns
❌ Common Mistakes
- Entering before pattern completion
- Ignoring context (trend)
- Trading against the main trend
- Skipping volume analysis
- Stop-loss too tight
- Trading on low timeframes
✅ Correct Approach
- Wait for complete formation
- Consider trend and levels
- Trade in trend direction
- Analyze volume
- Place stop beyond the pattern
- Use H1 and higher
Part 4: Practical Examples in the Cryptocurrency Market
Example 1: Bullish Engulfing on Bitcoin
Let's examine a classic bullish engulfing example on the Bitcoin daily chart:

Situation: After a prolonged decline, BTC formed a bullish engulfing at a support level. Note the elements:
- Preceding downtrend (5 consecutive red candles)
- Formation at a historical support level
- Second candle 3 times larger than the first
- Volume on bullish candle — above average
- RSI was in oversold territory
Result: Price reversed and rose 25% over the following two weeks.
Example 2: Evening Star on Ethereum
Evening star on the ETH 4-hour chart:

Situation: ETH was showing strong growth after positive news. An evening star formed at the top:
- First candle — large bullish after news-driven momentum
- Second candle — Doji with gap up (star)
- Third candle — bearish, closed below the midpoint of the first
- Pattern coincided with resistance zone
- RSI showed divergence
Result: Price reversed and fell 18% over the following week.
Example 3: Morning Star on an Altcoin
Morning star on an altcoin daily chart:

Key elements:
- Extended downtrend (over 60% decline)
- Star — nearly perfect Doji
- Third candle completely covered the first
- Volume increased as the pattern formed
- Coincided with a round psychological level
Important Observation: In the cryptocurrency market, patterns often form more "messy" than in textbooks. Don't wait for perfect formations — learn to see the essence of the pattern, not its ideal form.
Part 5: Checklists and Cheat Sheets
Quick Pattern Reference Guide
| Pattern | Type | Signal | Where to Look | Reliability |
|---|---|---|---|---|
| Bullish Engulfing | 2 candles | Buy | Bottom of downtrend | ⭐⭐⭐⭐ |
| Bearish Engulfing | 2 candles | Sell | Top of uptrend | ⭐⭐⭐⭐ |
| Morning Star | 3 candles | Buy | Bottom of downtrend | ⭐⭐⭐⭐⭐ |
| Evening Star | 3 candles | Sell | Top of uptrend | ⭐⭐⭐⭐⭐ |
| Doji Star | 3 candles | Depends on position | Trend extremes | ⭐⭐⭐⭐⭐ |
Pre-Trade Entry Checklist
Check Before Clicking "Buy/Sell"
- Pattern is fully formed (candle has closed)
- There's a clear preceding trend
- Pattern is at a key level
- Volume confirms the pattern
- Indicators don't contradict the signal
- Risk/reward ratio is at least 1:2
- Position size follows money management rules
- Stop-loss is predetermined
- No major news events coming soon
- I'm calm and acting according to plan
Homework
To reinforce the lesson material, complete the following practical assignments:
- Pattern hunting: Open daily charts of 5 different cryptocurrencies. Find at least 3 examples of engulfing patterns and 2 examples of star patterns from the last 3 months.
- Context analysis: For each pattern found, describe: preceding trend, presence of levels, volume, RSI readings.
- Result evaluation: Track what happened after each pattern. Did the signal work? If not — why?
- Demo trading: Throughout the week, monitor the formation of new patterns and open virtual trades on a demo account.
Conclusion
Engulfing patterns and stars are fundamental tools in the candlestick analyst's arsenal. They show not just price movement, but the story of battle between buyers and sellers, moments of turning points and power shifts in the market.
Key lesson takeaways:
- Context matters more than pattern: Even a perfect pattern without proper context is just a pretty picture
- Confirmation is mandatory: Use levels, volume, and indicators to filter signals
- Practice creates mastery: The more patterns you analyze, the better you'll spot them
- Risk management comes first: No pattern works 100% of the time — always use a stop-loss
In the next lesson, we'll study trend continuation patterns: "Three White Soldiers," "Three Black Crows," and other formations that will help you hold profitable positions and add to them at the right moments.
Wisdom of Japanese Traders: "He who sees the star in the morning sky greets the dawn. He who sees the star in the evening sky prepares for night. The wise trader sees both and acts accordingly."